Take AAPL as of 05/28/2010 as example, it closed at 256.88 on 05/28/2010.
Ratio Spread
Buys N calls at a lower strike and sells more than N calls at a higher strike.
The maximum profit happens when the underlying closes at the higher strike on expiration date.
Maximum profit point = initial credit + (higher strike - lower strike)
Upside breakeven point = higher strike + Maximum profit point
Here I use 1:2 ratio July calls, notice the margin requirement is $42756.
 |
| From misc |
Position summary and P/L graph:
 |
| From misc |
 |
| From misc |
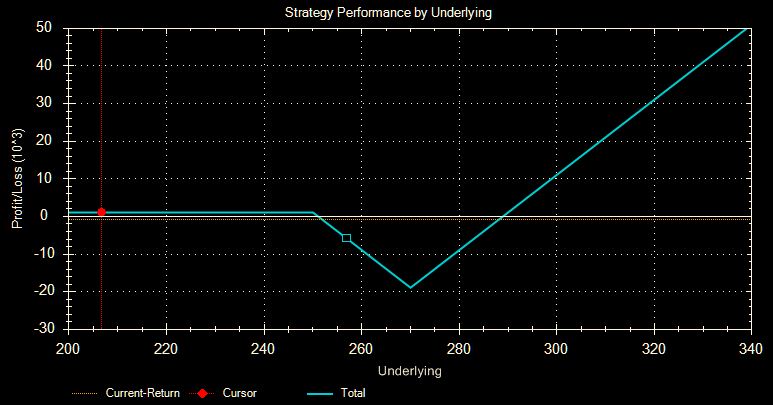
Buy N calls at higher strike and sell less than N calls at lower strike.
Maximum loss happens when the underlying closes at the higher strike on the expiration date.
Max loss = higher strike - lower strike - credit received
Upside breakeven point = higher stike + point of max loss
Downside breakeven point = lower strike
Position:
 |
| From misc |
Position summary and P/L graph, notice the margin is small, $18900
 |
| From misc |
 |
| From misc |
Clearly, backspread favors volatile securities, it expects underlying move up dramatically. It has the following advantages:
1. stock moves up beyond breakeven point by expiration.
2. stock moves up modestly early in the life cycle of the trade.
3. market condition causes IV to move up.
4. stock falls sharply and recovers.
On the other hand, ratio spreader expects underlying move up, but not too much and too quickly.
Finally, the probability shows backspread is somehow like bullish straddle:
 |
| From misc |
No comments:
Post a Comment